investr.info
An AI-powered stock research tool that pulls together fundamentals, technicals, news sentiment, analyst data, and macro context. Started life as StockLens. Got rebuilt end-to-end after the first version wasn't good enough.
Why I built it
When I started following markets seriously I found the tools available were either too shallow (price charts and nothing else) or too expensive (Bloomberg terminal). What I actually wanted was a way to synthesize everything around a company fast: what the news was saying, what analysts thought, where the macro was sitting, and whether the numbers backed any of it up.
So I built it. LLMs handle the synthesis and I supply the questions. The whole thing started as a personal research tool and I keep adding to it as I find gaps.
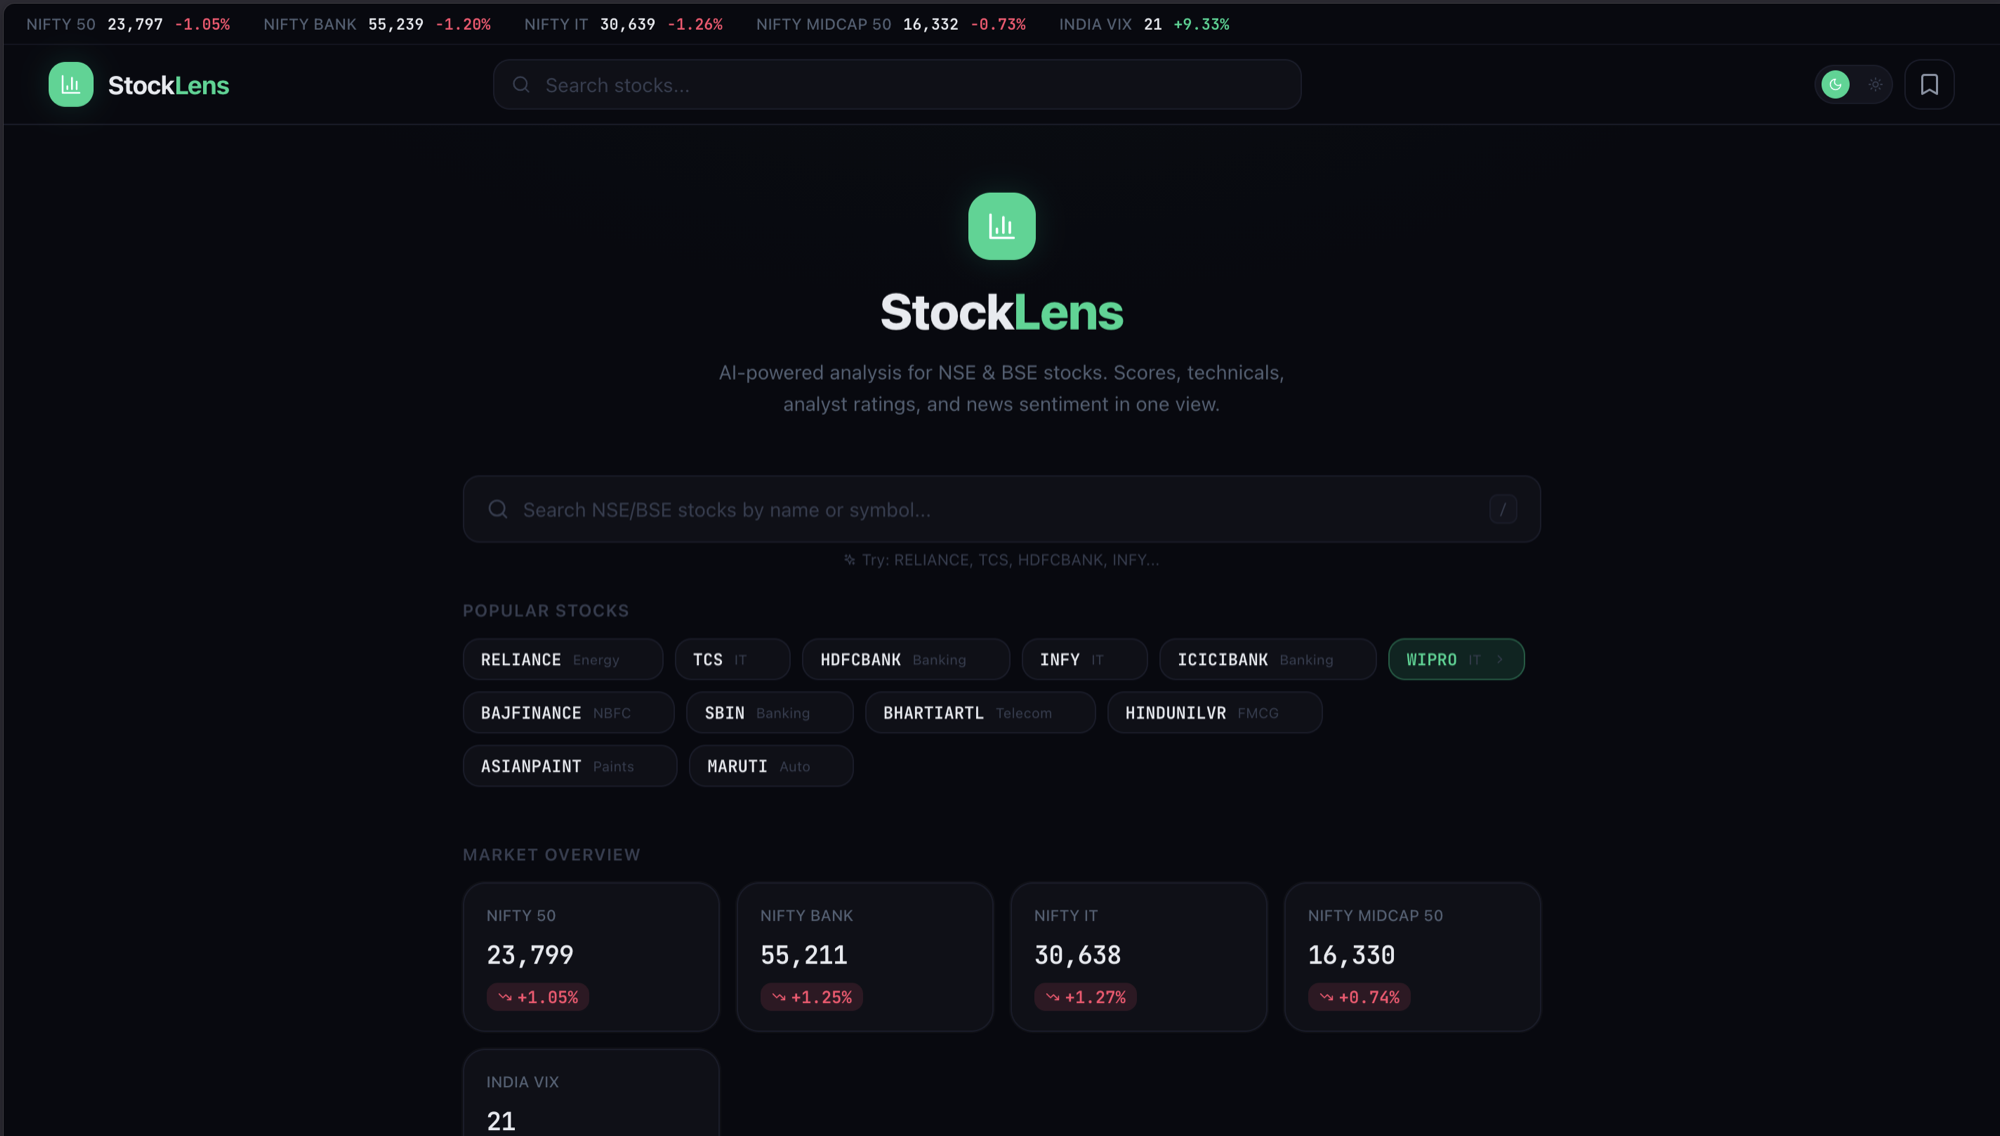
StockLens
The first cut, and what was wrong with it
V1 shipped as StockLens. It worked, but it had three problems I couldn't ignore.
The data was shaky. I was pulling prices and fundamentals from Yahoo Finance and Twelve Data. Both were fine in isolation and neither was reliable enough to trust on its own. Yahoo would sometimes return stale closes or miss Indian tickers entirely, especially post-demerger or for smaller NSE names. Twelve Data had its own holes in coverage and rate limits that would silently truncate responses. Getting an API key working with either was a fight of its own: free-tier quotas, key rotation, different symbol formats for NSE vs BSE vs global exchanges. Half the time the tool would confidently display a number that was just wrong.
The scores reflected the bad data. If the underlying price or P/E was stale, everything downstream was too. The AI score would tell me a stock was a Buy based on numbers that didn't match what was actually on the tape.
It didn't look nice. Functional enough for me, but not something I wanted to show anyone. The information was there, but the presentation didn't make it easy to use.
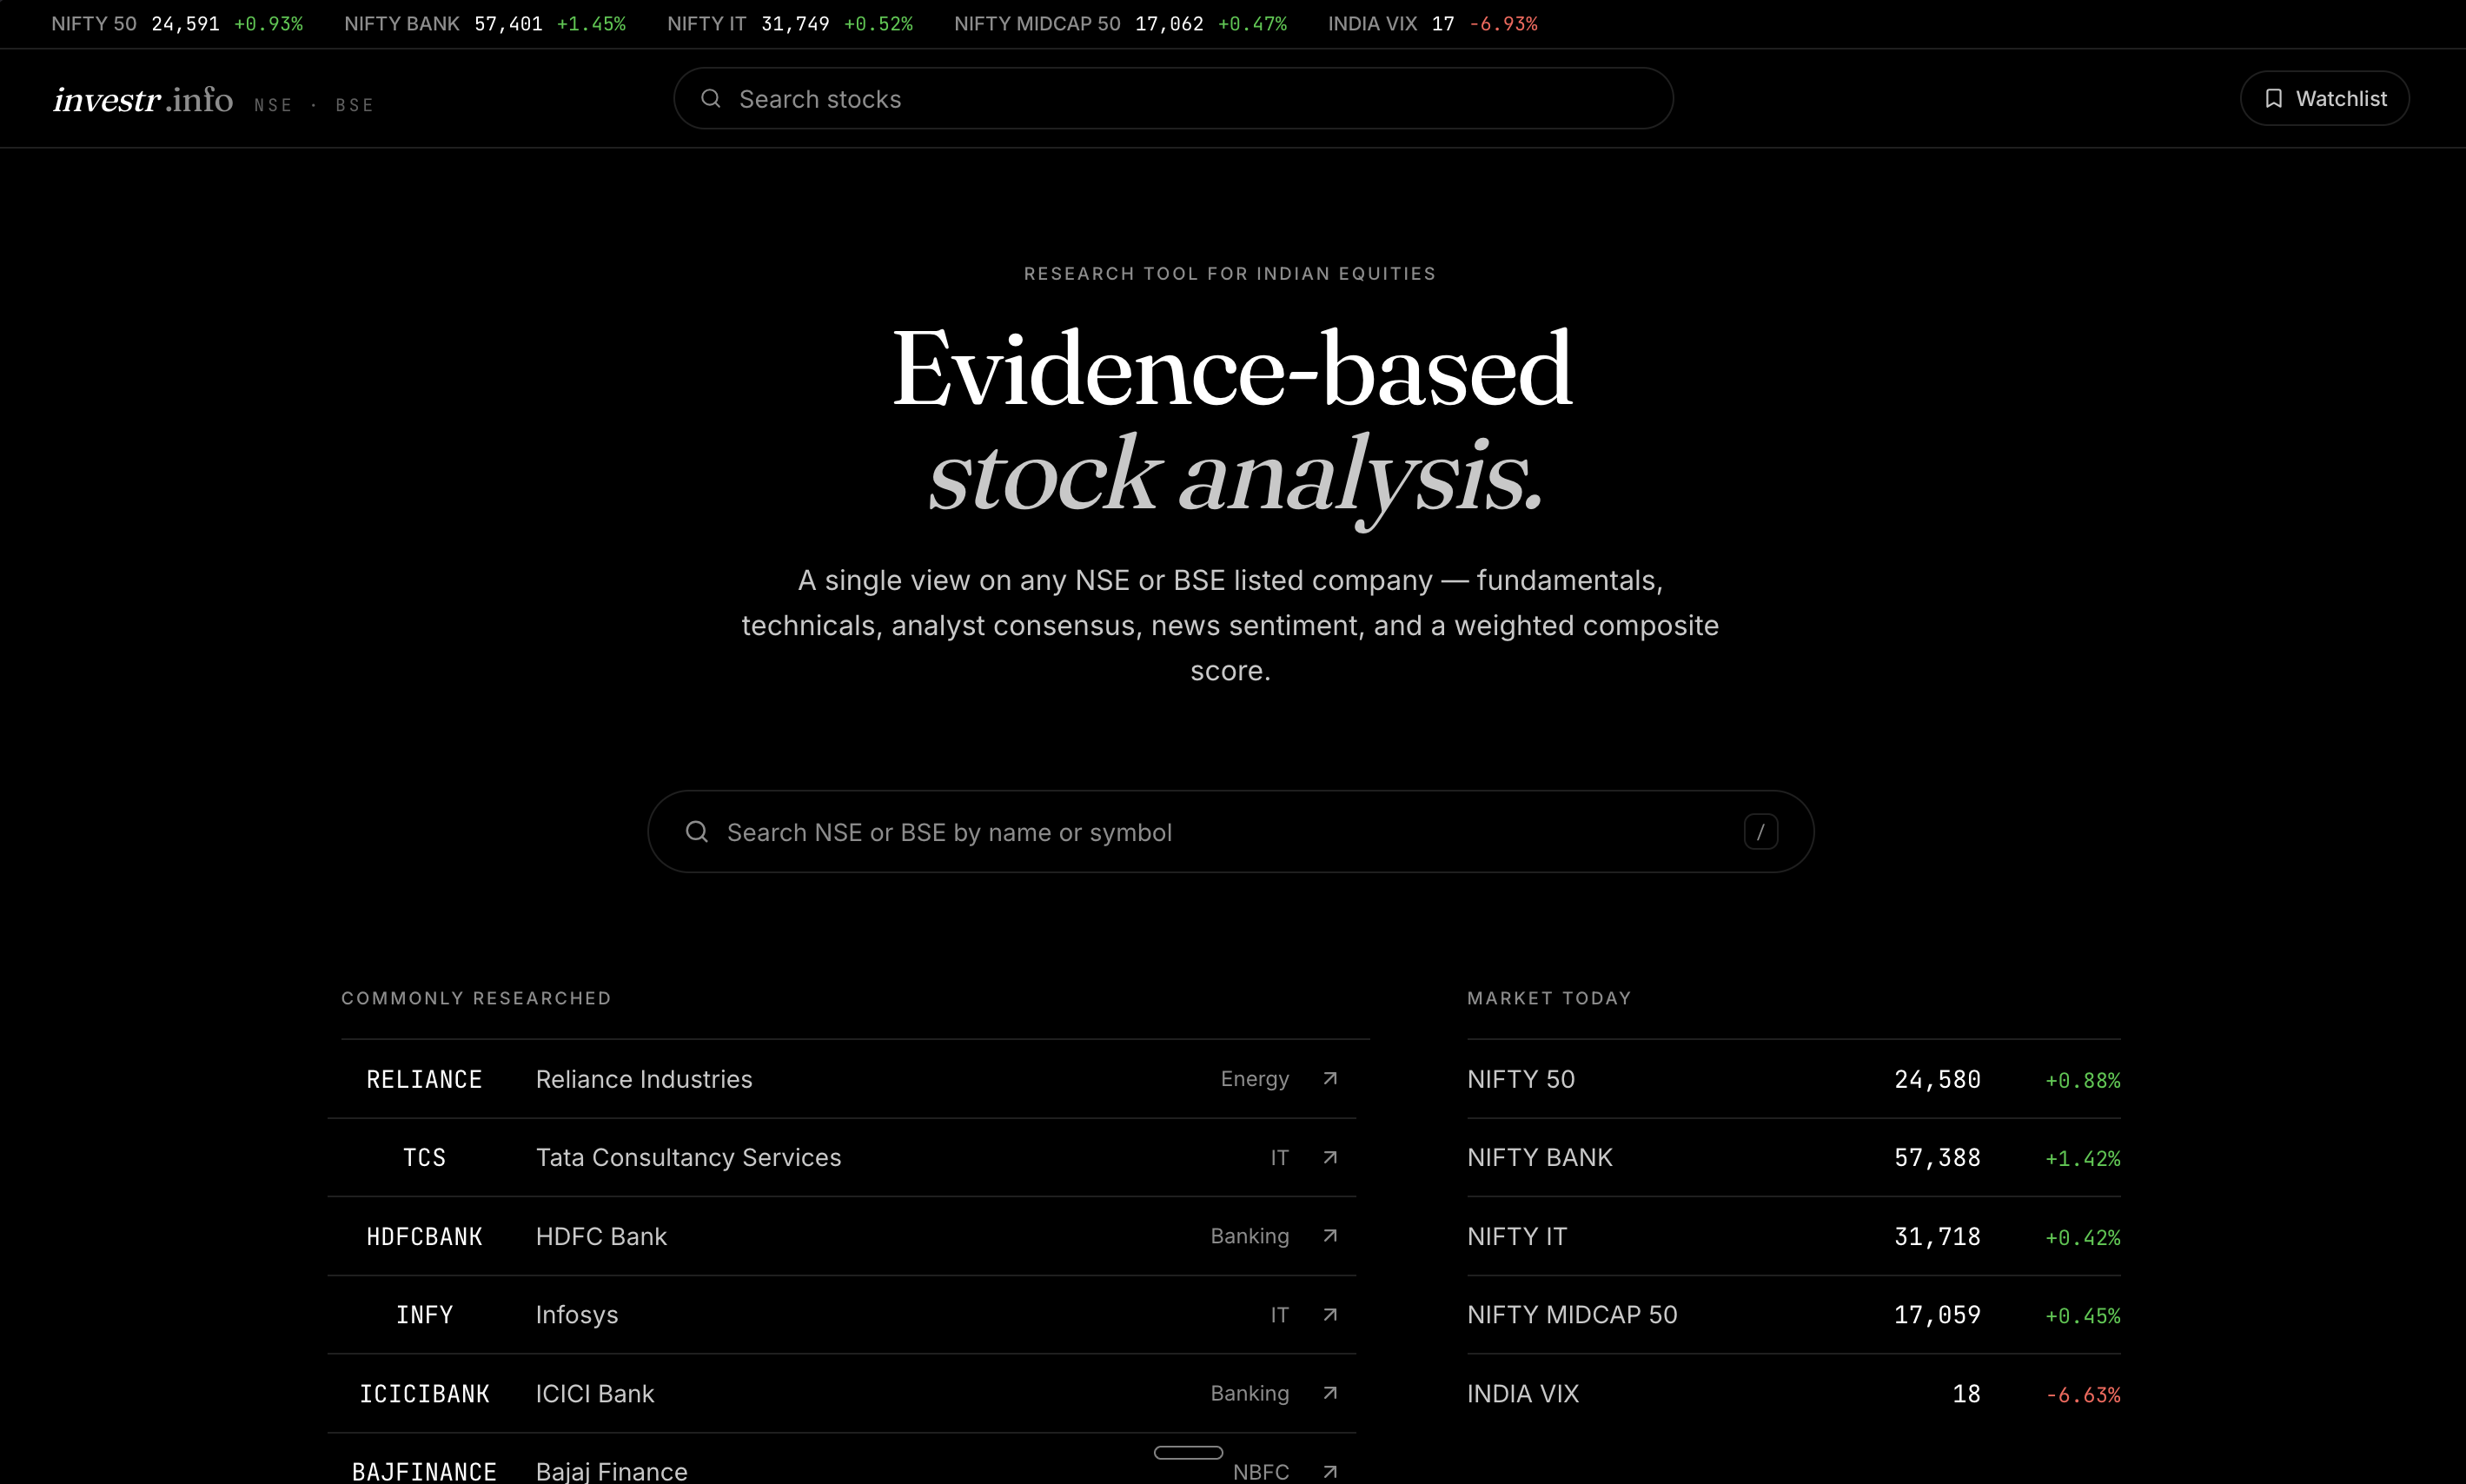
investr.info
Rebuilt for accuracy, and renamed
V2 is a full rewrite. The data layer was the first thing I fixed: I stopped trusting any single provider and started cross-checking every figure against a second source before it ever reaches the UI. Tickers got normalized properly across NSE and BSE. When a source disagrees with another, the tool now flags it instead of pretending it's fine. The scoring engine sits on top of that, so the signals are only as strong as the numbers they're built on.
I also redesigned the whole thing. Cleaner layout, better typography, the data actually reads like data. The plain-English insight is still there but it's no longer doing cleanup work for a broken pipeline.
On the name. The plan was always to ship it as StockLens, but the domain was taken. I went through a bunch of alternatives and landed on investr.info. It reads like "investor" without being cute about it, the .info TLD actually fits what the tool does, and the whole thing is short enough to remember. Good enough.
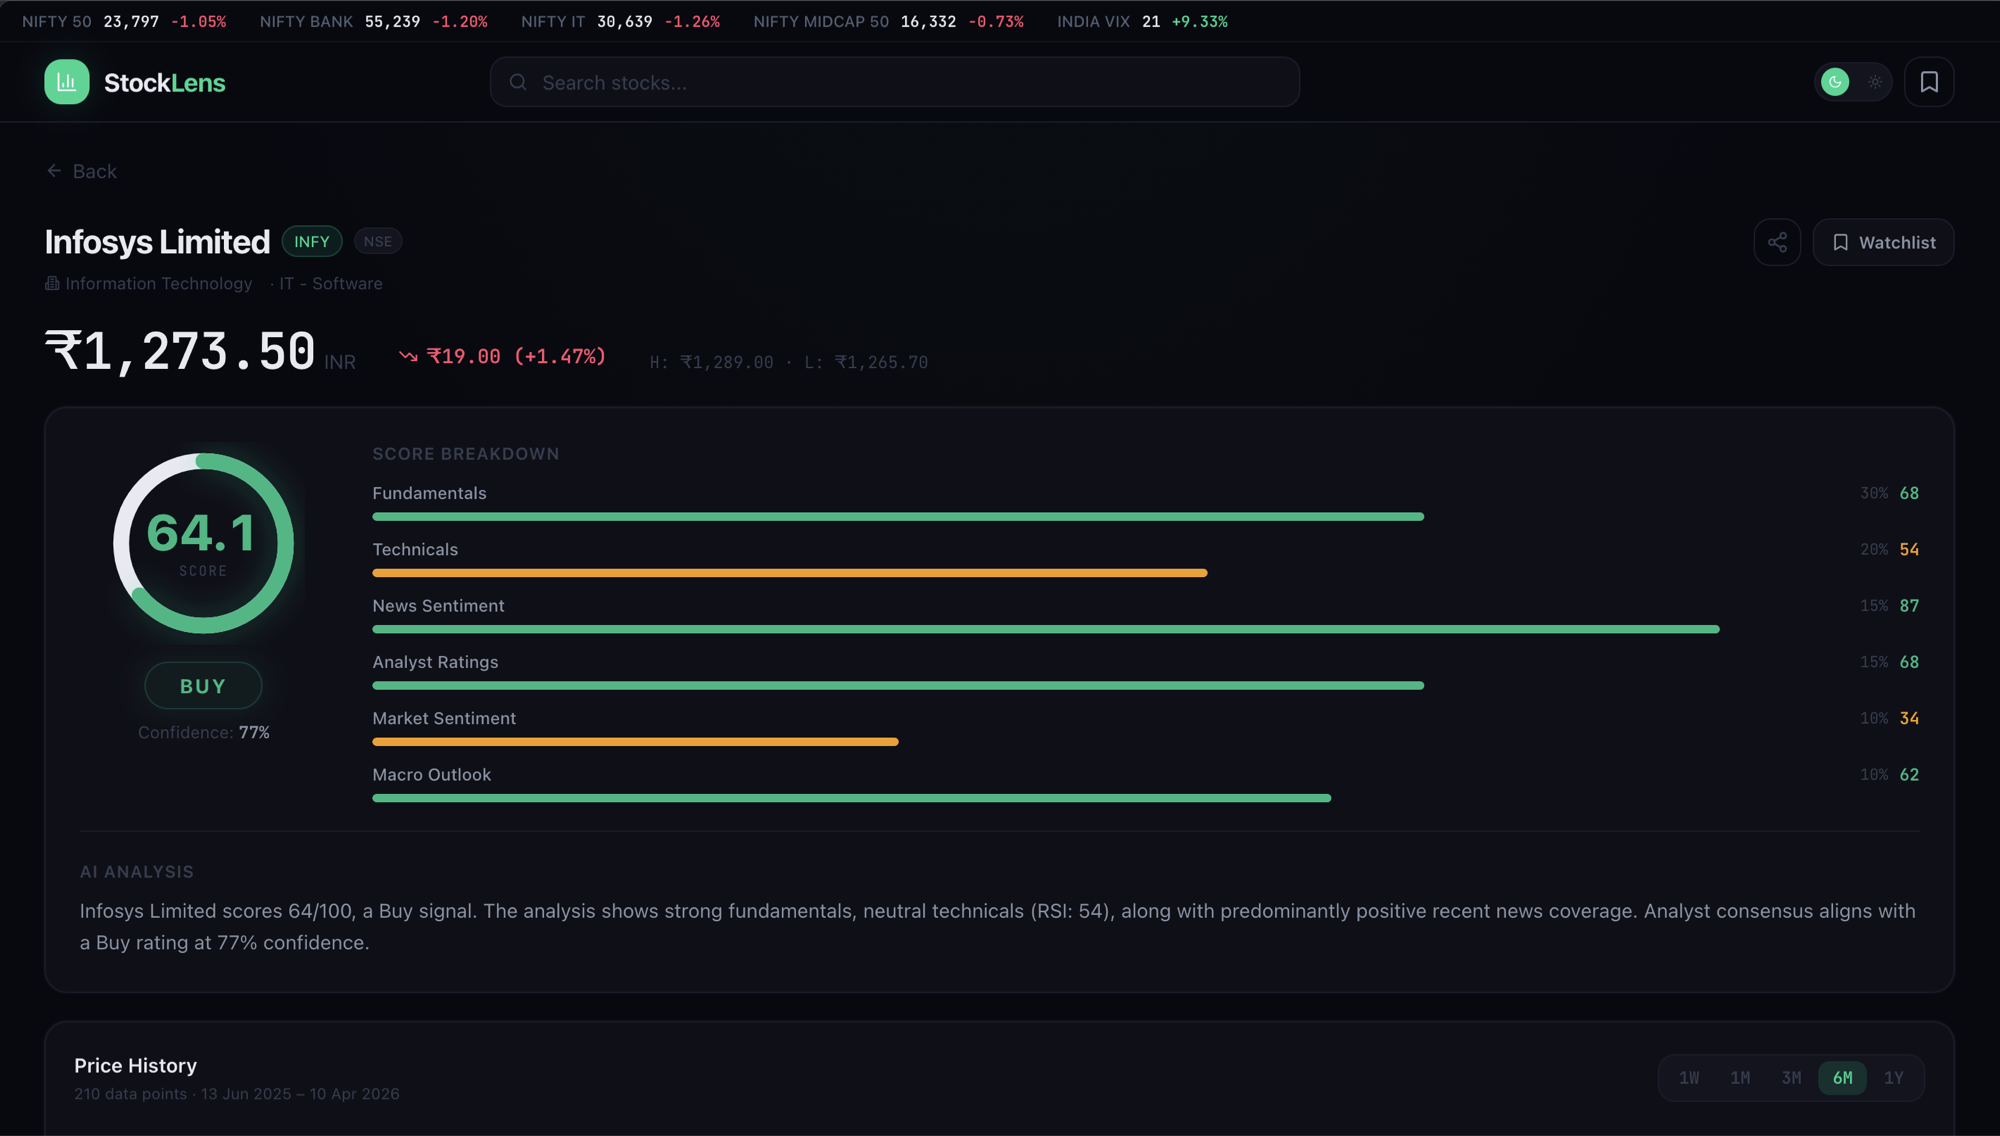
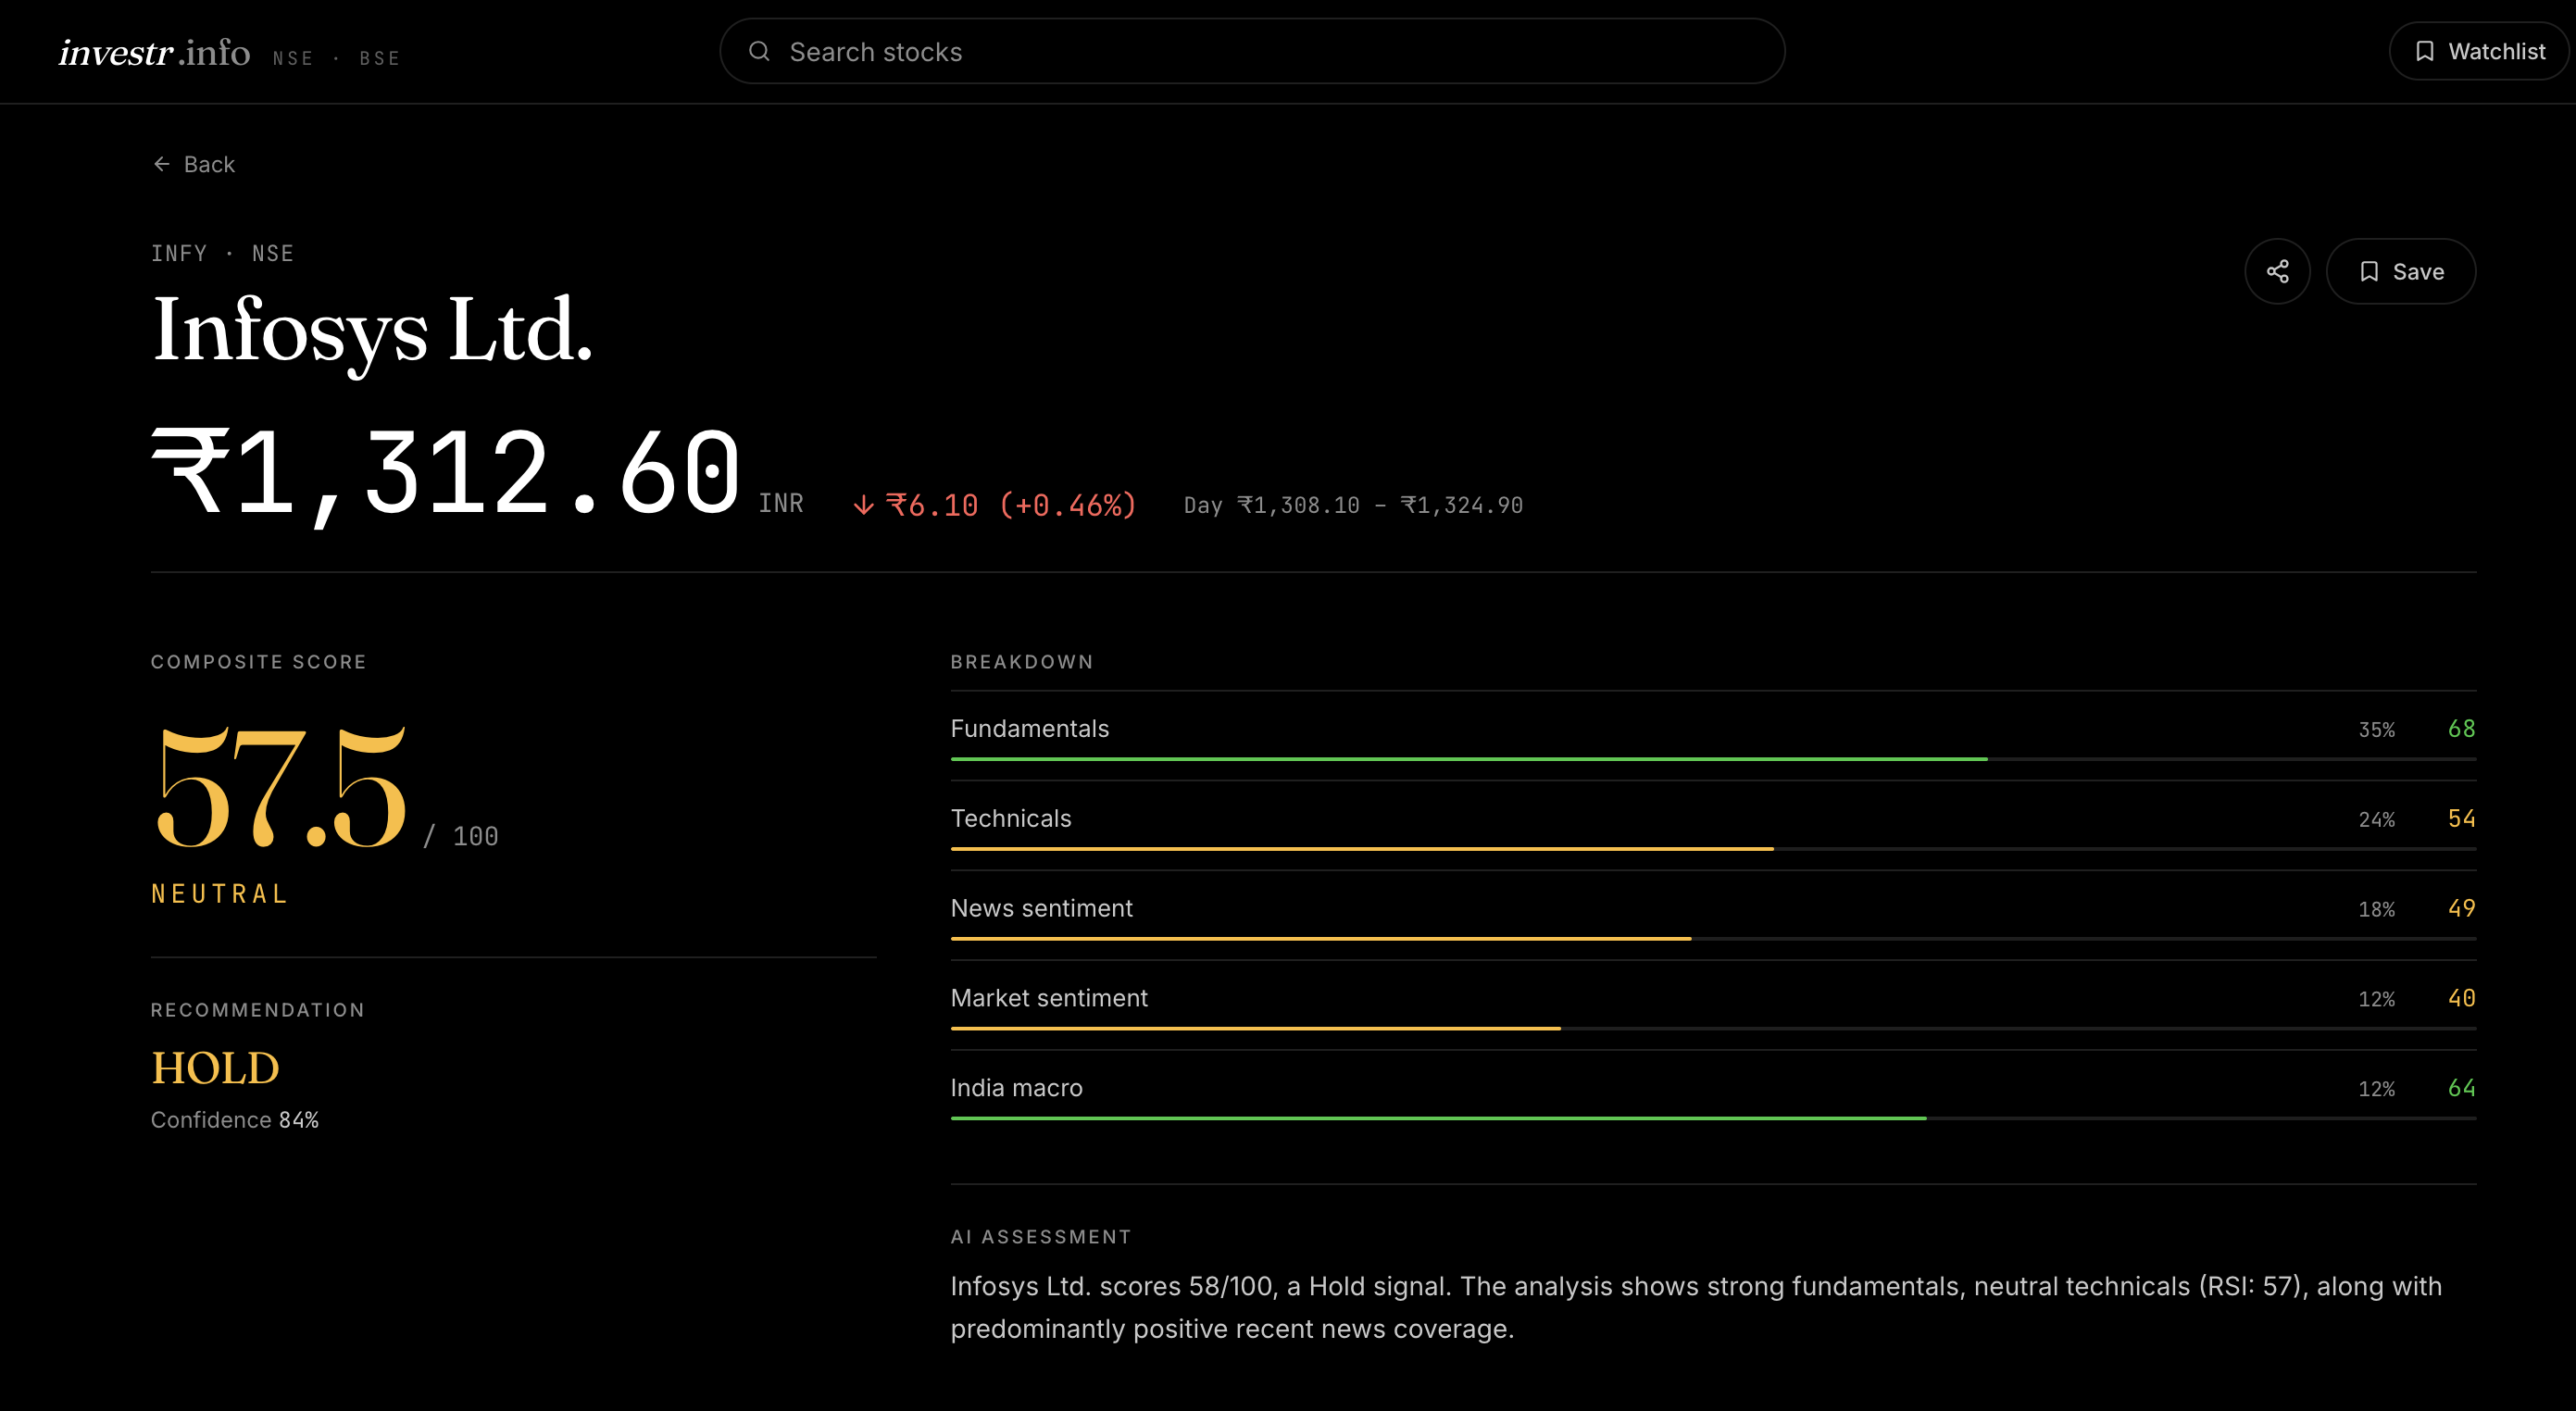
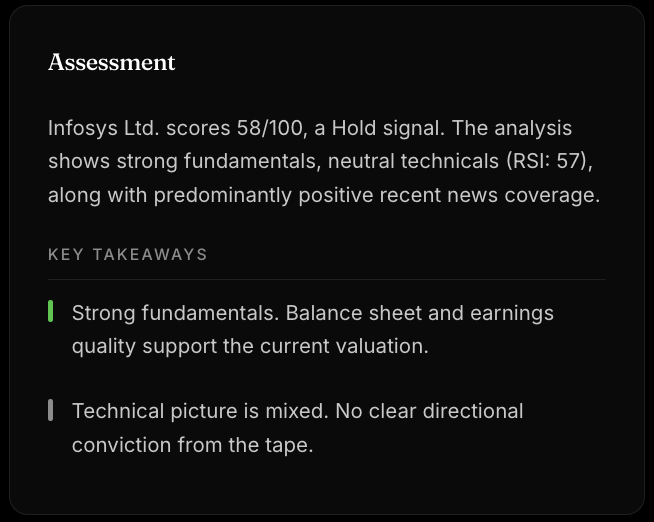
AI score and signals
The core of investr.info is a composite AI score from 0 to 100 built from six inputs: fundamentals, technicals, news sentiment, analyst ratings, market sentiment, and macro outlook. Each has its own weight and feeds into a Buy / Hold / Sell signal with a confidence percentage. In V2 each of those inputs is now cross-sourced, so the weighting isn't being distorted by a bad pull.
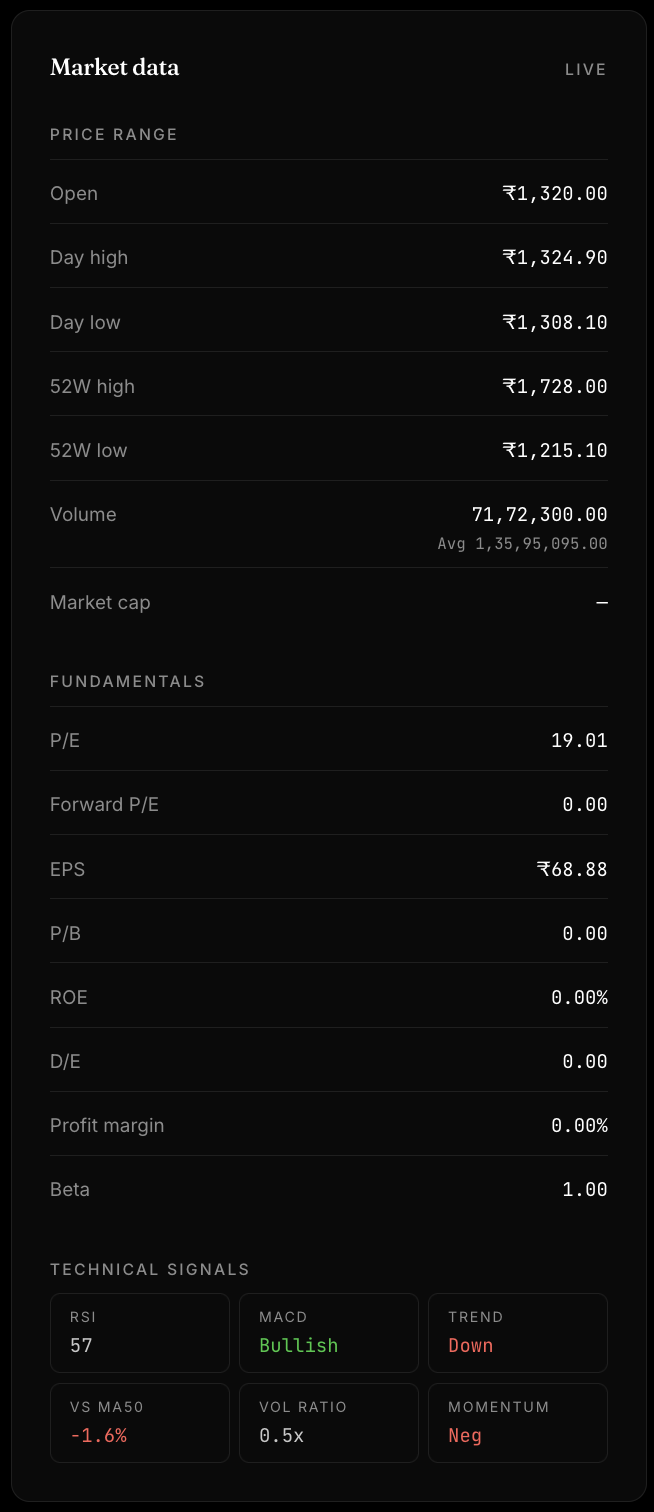
Market data and fundamentals
Every stock page shows live price data alongside the full fundamental picture: P/E, forward P/E, EPS, P/B, ROE, D/E, profit margin, and beta. Technical signals — RSI, MACD, trend direction, volume ratio — are displayed as quick-read indicators. In V2 the fundamentals are cross-sourced, so a single bad pull from one provider doesn't quietly corrupt the whole panel.
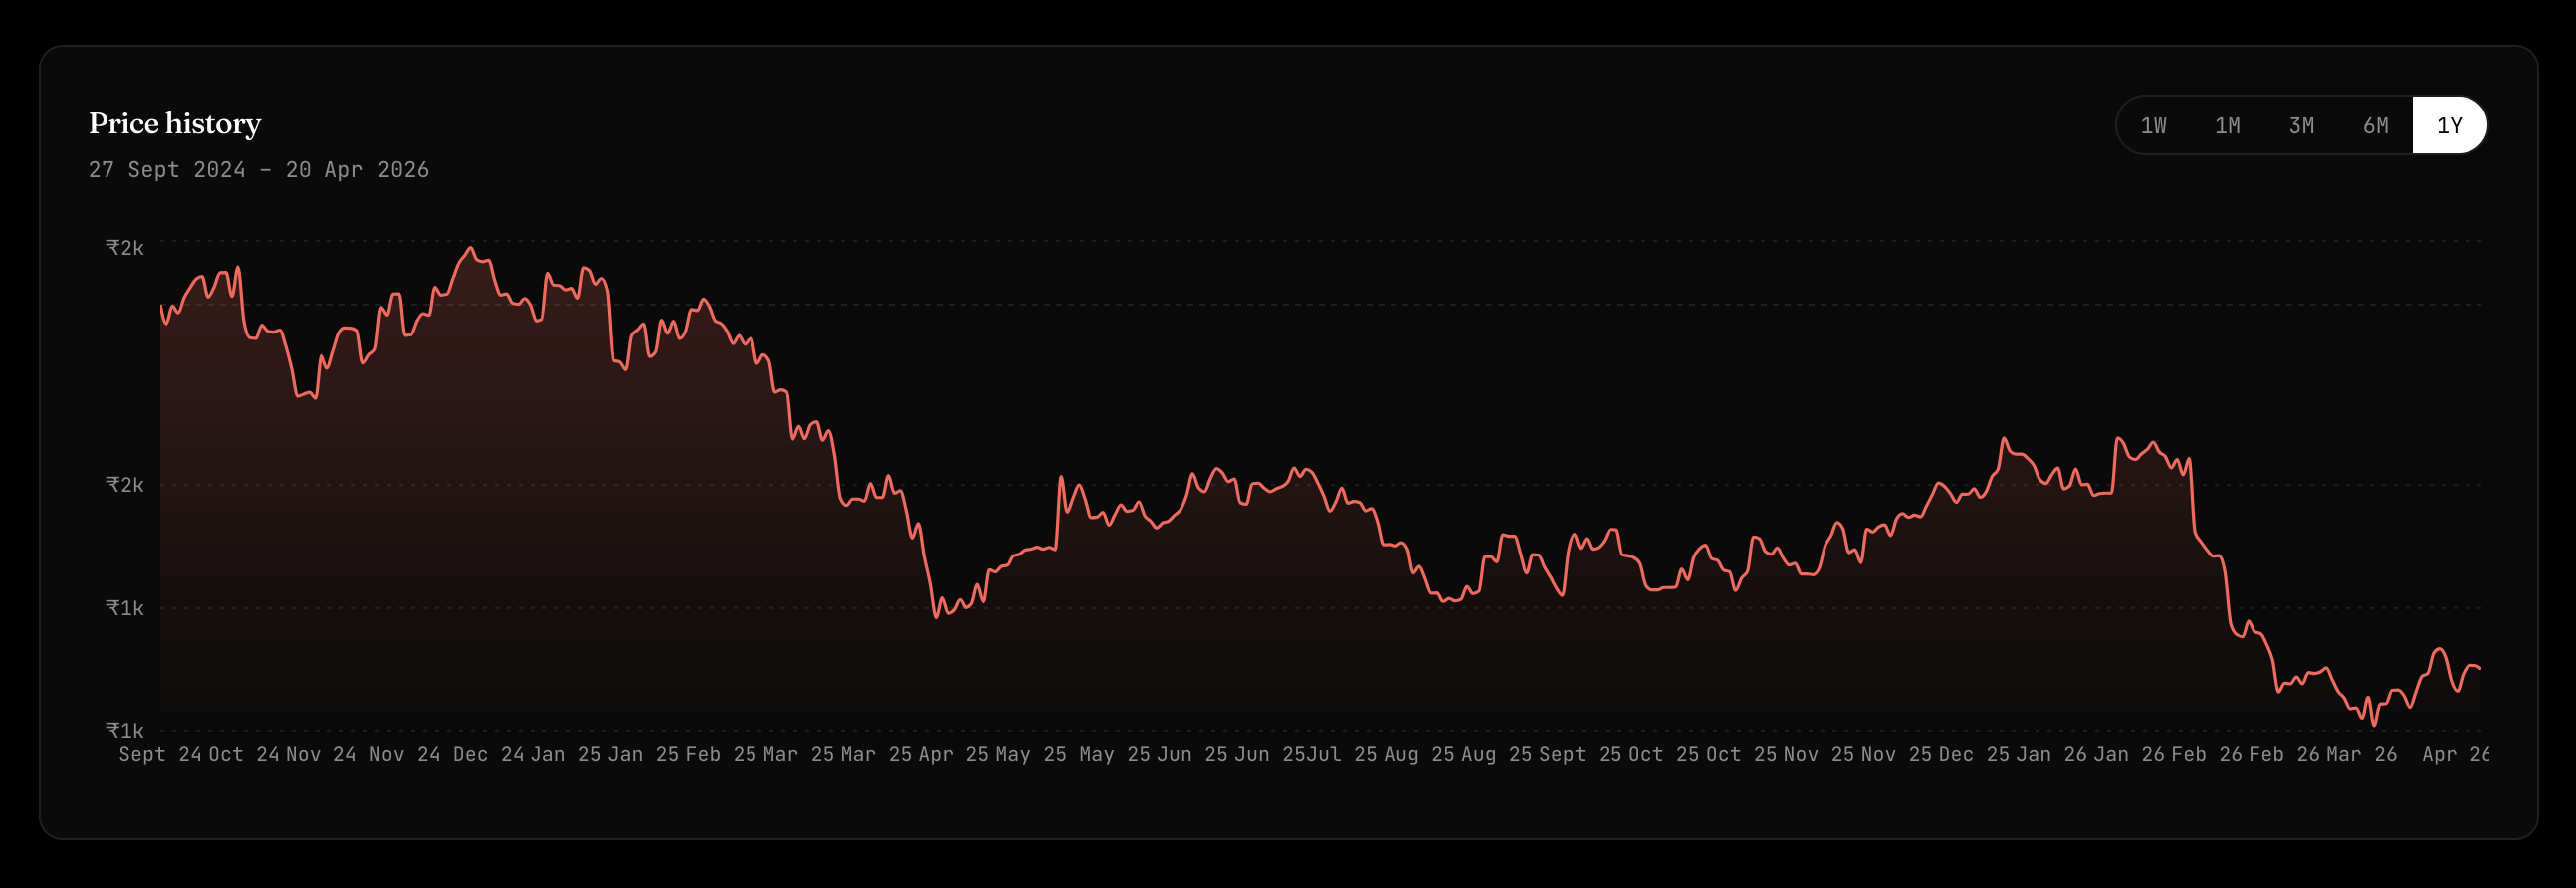
Price history
Interactive price chart with selectable timeframes from one week to one year. In V2 the underlying price series is cross-validated so the chart matches what the exchange actually closed at.
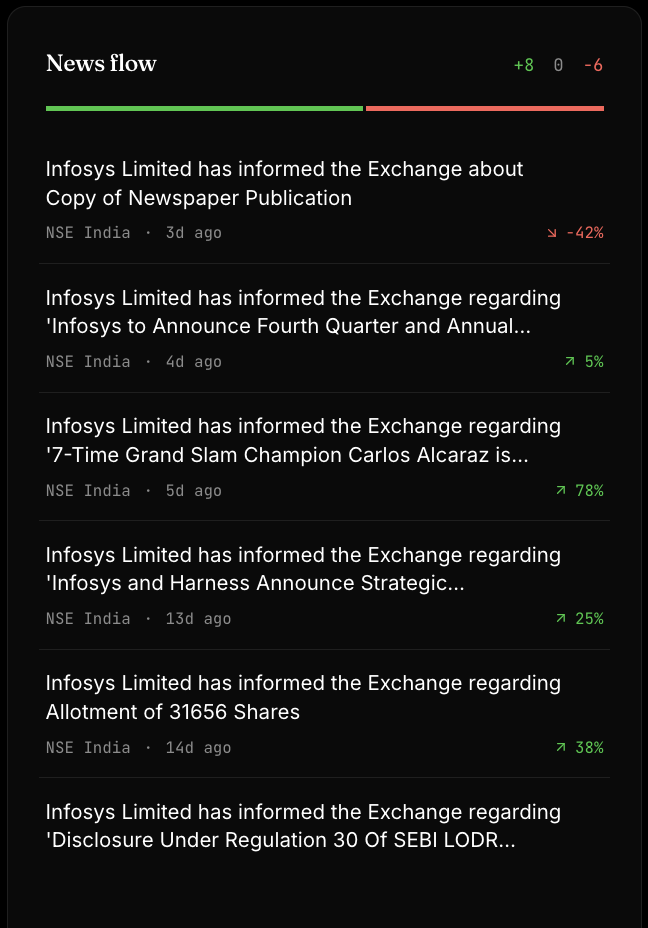
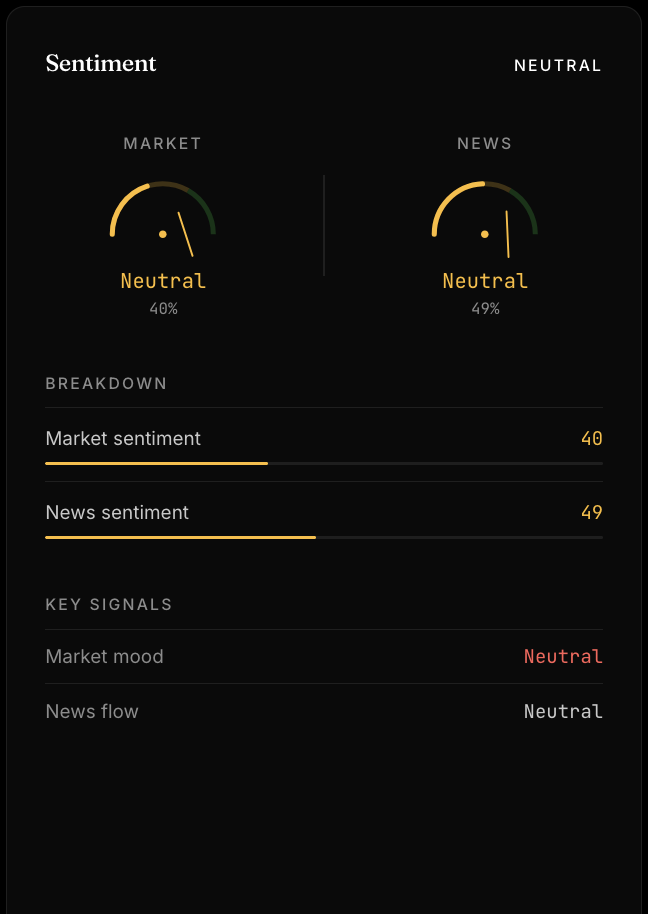
News flow and sentiment
Each stock pulls recent filings and news and scores them for sentiment. Positive, neutral, and negative counts are shown as a bar at the top, with each headline and its sentiment score below. The sentiment panel breaks this down further into market sentiment and news sentiment, shown as separate gauges with a percentage confidence.
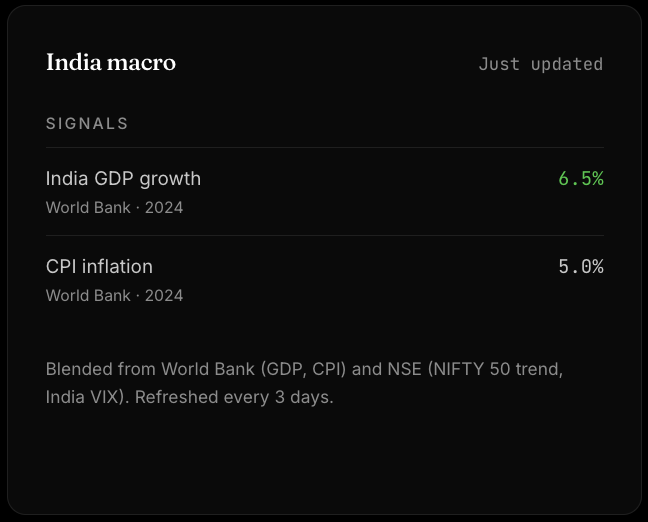
India macro
A macro context panel that sits alongside every stock. It pulls India GDP growth and CPI inflation from the World Bank plus the NIFTY 50 trend and India VIX from NSE, and refreshes every three days. Context matters when you're looking at Indian equities — knowing where the macro is sitting changes how much weight you put on individual stock signals.
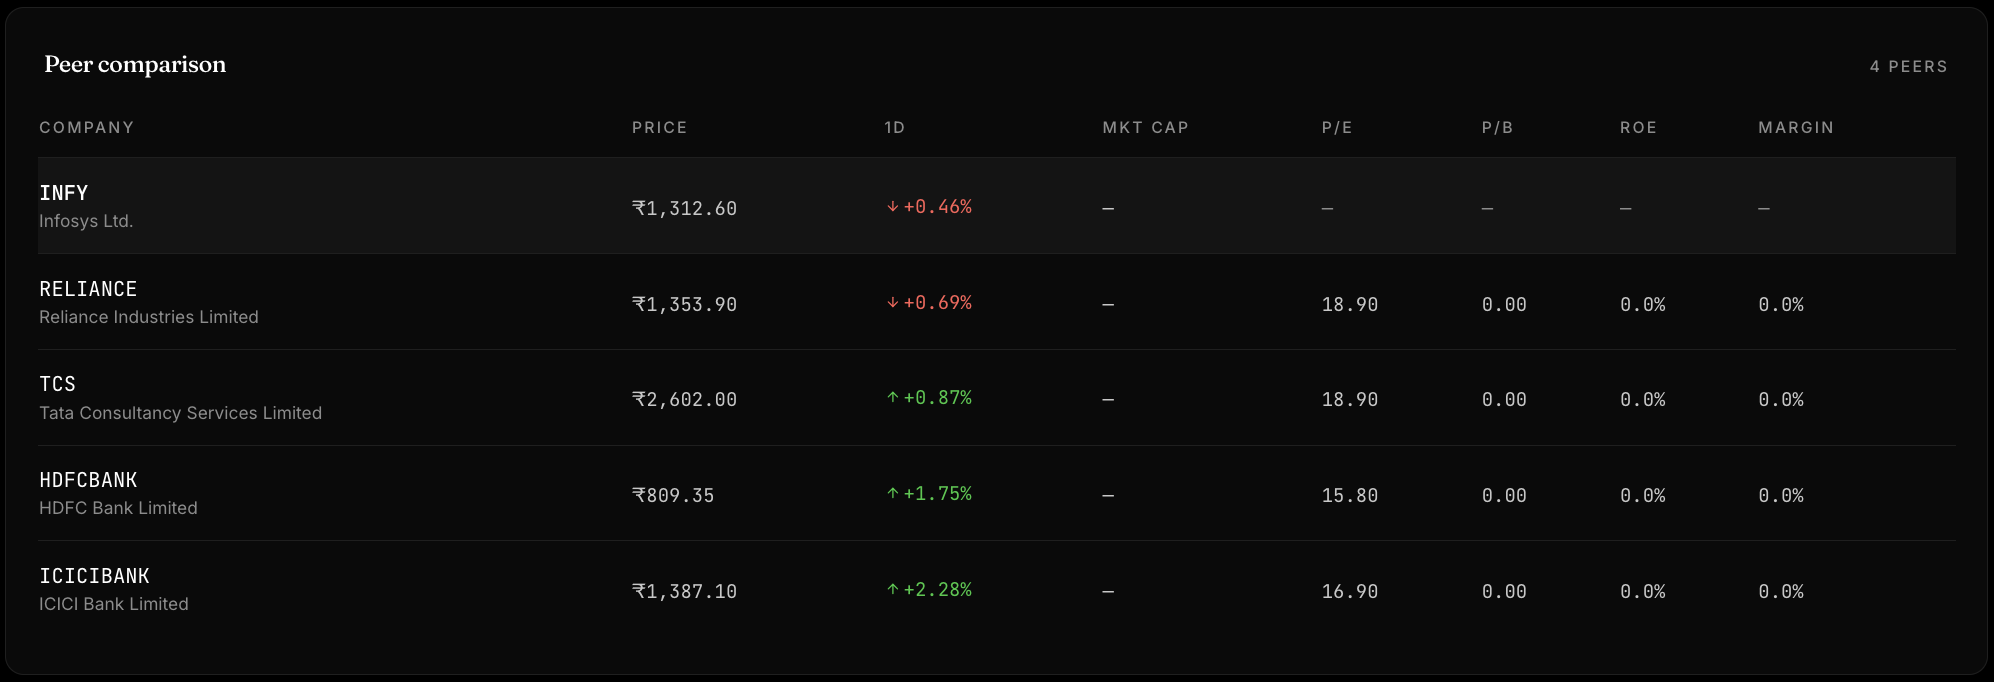
Peer comparison
A table of sector peers showing price, daily move, market cap, P/E, P/B, ROE, and margins side by side. Useful for relative valuation at a glance without switching tabs.
- Search any NSE/BSE listed stock by name or ticker
- Composite AI score across six dimensions with a Buy/Hold/Sell signal
- Cross-sourced price and fundamentals to catch bad data before it reaches the UI
- Interactive price history with multiple timeframe views
- LLM-generated plain-English explanation of the score
- News sentiment analysis with per-article scoring
- Analyst consensus, price target, and upside/downside
- India macro snapshot: Nifty, Bank Nifty, India VIX
- Peer comparison table for relative valuation
- Watchlist to track stocks across sessions